With the recent release of the SPRacingF3 flight controller and the Seriously Dodo flight controller, both based on the newer STM32 F3 CPU, users have been posting great Blackbox flight logs demonstrating very fast and consistent looptimes. I found this interesting because the F3’s CPU isn’t clocked any faster than the F1 processor that is used on the Naze32 and compatibles.
One major difference between these CPUs is that the F3 has a hardware floating point unit, while the F1 must emulate its floating point support using some very large software routines. Floating point support is used in the IMU (which is responsible for estimating the craft’s attitude) and also as part of some PID controllers such as the new Harakiri controller. It’s not heavily used in any other parts of the code.
But how much time does the Naze32 spend doing floating point operations anyway? What is the total possible speedup available from just adding a hardware floating point unit? Could I speed my Naze32 up some other way?
In order to find out, I built a Sampling Profiler feature for Cleanflight. A sampling profiler works by periodically interrupting the program’s execution to check what code is currently running. The profiler makes 1000 of these checks per second and sends the results out to a serial port to be logged.
The checks can be used to measure what percentage of the time is spent on each line of code in the program. If one piece of code accounts for 30% of the execution time of the program, then we should expect 30% of our random samples to end up seeing that line of code being run. In this way we can construct an accurate picture of the program with a nice constant overhead.
If the profiler slows down the CPU too much, we only have to reduce our sampling rate and sample for longer. Our results will be the same, and CPU sampling overhead will decrease.
Limits
This profiler is somewhat limited because it can only see the top function that was executing when it takes a sample. It doesn’t currently have the ability to look up the stack and see which functions were responsible for calling the function that was interrupted.
This can make it harder to work out which parts of the code are the culprits for slowdowns, because some routines are shared by many parts of the program. It also means that functions which mostly just call other functions to do their work for them will have very low execution times as measured by the profiler.
The very highest priority interrupt handlers (I2C EV and ER interrupt handlers) are not measured by the profiler. This is because the profiler is not high priority enough to interrupt them. I configured it this way because of the I2C documentation’s warning that the interrupt handlers should not themselves be interrupted (I assume they’re too timing sensitive).
Results
You can see the raw output from the profile log decoder here. The results are pretty interesting. I was running a Naze32 Full with a PPM receiver, PID controller 0, looptime set to 0 and all other features disabled, so pretty much a barebones system.
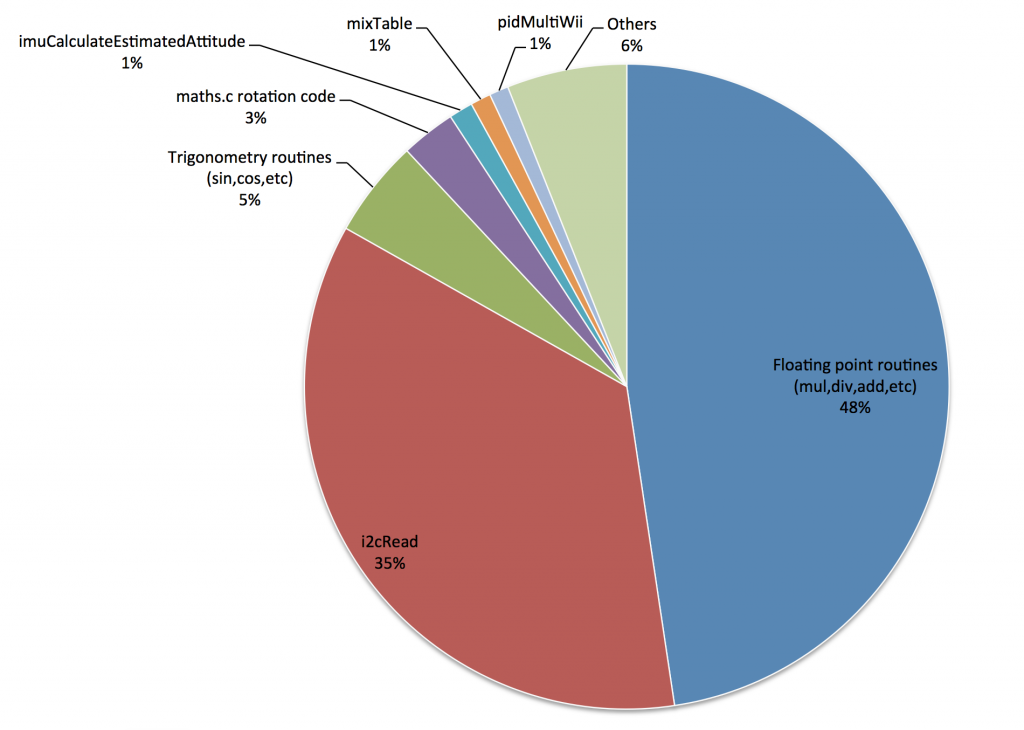
You can see that the majority of runtime is spent on floating point routines (48%) plus trigonometry routines (5%), which are the likely callers of most of the floating point routines. This is great news for the SPRacingF3 because these are precisely the routines that will be sped up by its hardware floating point unit!
Of the remaining time, 36% is spent just waiting to receive data from the gyroscope over the I2C bus. I haven’t examined this code before, but from a quick glance it appears that the CPU performs a busy-wait while it waits for a response to be received from the gyroscope. If this task could be handed off to the DMA controller, which would perform the read in the background, it could potentially free up to 36% of the CPU time for other tasks.
It’s clear that it’s not worth speeding up any other part of the code, because the remainder accounts for such a small percentage of the total runtime. This information is a win for developers because we don’t need to waste our time on something that isn’t going to make a difference to looptimes!
Speeding up the Naze32
So, the SPRacingF3 is likely faster than the Naze32 because its floating point operations are faster. But can I squeeze more speed out the Naze32? There are two main approaches here.
One option is to speed up the floating point routines themselves. One way of doing this is to use routines which are slightly less precise than the default implementation, which can bring large speedups. The default implementation is extremely pedantic about being precise and handling error conditions in order to conform to IEEE floating point standards, but in a noisy system like a quadcopter that precision isn’t noticeable. To this end, some developers have been discussing Taylor approximations of our trigonometry routines over on the Cleanflight issue tracker.
The other option, which is even simpler, is to avoid the calls that require floating point in the first place. Since I’m flying PID controller 0, the main place in the code that is actually using floating point is the IMU’s attitude estimator. This is responsible for figuring out the roll/pitch angles and heading of the quadcopter. That information is required for Angle and Horizon flight modes, as well as the flight modes based on sensors like the magnetometer and barometer. But good old Acro flight mode doesn’t use the IMU at all, because it only uses rotation rates read directly from the gyroscope.
Luckily, I happen to be an acro-only pilot. So in my case, the only thing the IMU is being used for is the pretty display of the 3D model in the Configurator’s welcome page. Let’s see what happens when I turn off my accelerometer, which causes the IMU to never run:
Entering CLI Mode, type 'exit' to return, or 'help'

# set acc_hardware
acc_hardware = 0

# set acc_hardware=1
acc_hardware set to 1
# save
$ blackbox_decode LOG-ACRO.TXT
Decoding log 'LOG-ACRO.TXT' to 'LOG-ACRO.01.csv'...

Log 1 of 1, start 00:18.056, end 00:28.247, duration 00:10.190

Statistics
Looptime            325 avg           10.3 std dev (3.2%)
I frames     978   44.1 bytes avg    43094 bytes total
P frames     978   24.5 bytes avg    23994 bytes total
E frames       2    9.0 bytes avg       18 bytes total
S frames       8    4.0 bytes avg       32 bytes total
Frames      1956   34.3 bytes avg    67088 bytes total
Data rate  191Hz   6696 bytes/s      67000 baud

29325 loop iterations weren't logged because of your blackbox_rate settings (9552ms, 93.75%)
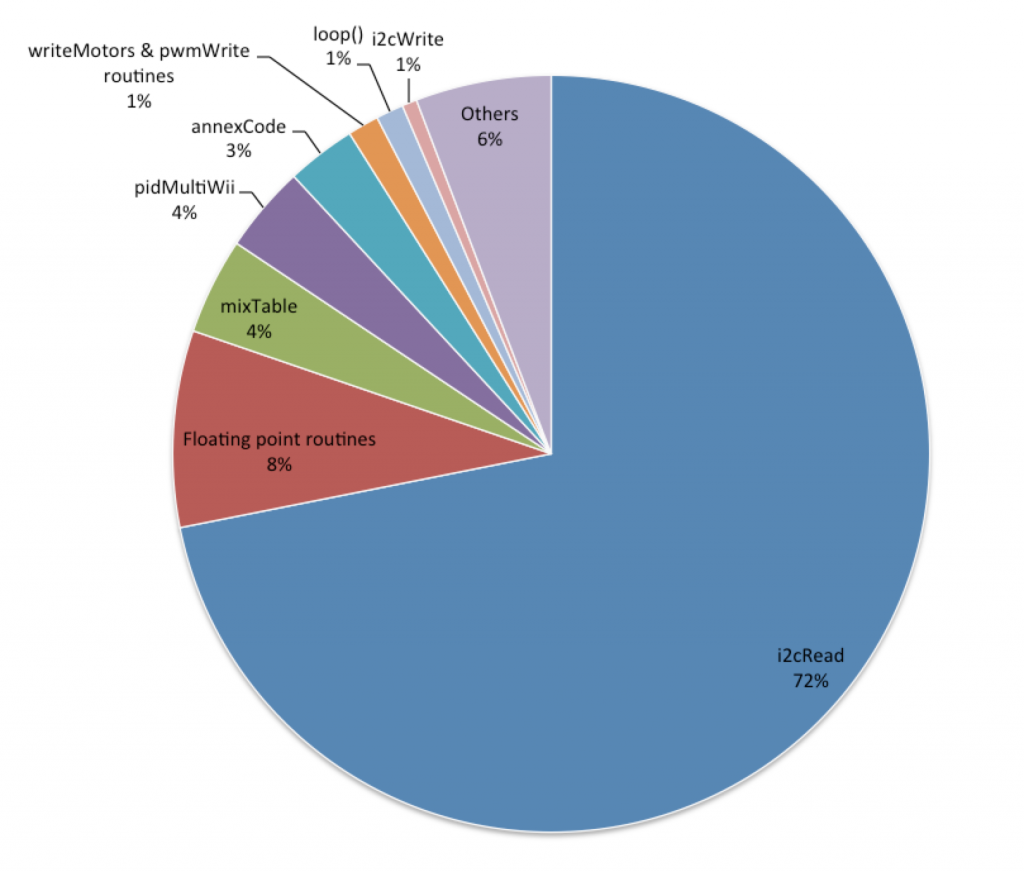
Yep, that’s a looptime of 325 with standard deviation of 10.3 microseconds! It looks like 1/8 logging rate is about as much as the Blackbox can keep up with at 250,000 baud. It’s now a lean, mean, acro machine! Here’s what the distribution of execution time now looks like according to the profiler:
i2cRead didn’t get slower, it probably stayed the same, but now it accounts for a larger portion of the total runtime because the floating point routines have shrunk so much. Now we’re seeing the actual flight code taking up a noticeable portion of the runtime, like mixTable() which is responsible for deciding what strength each motor should be driven at, and the PID controller itself. Here’s the raw profiler report for my acro-only configuration.
Sourcecode
The version of Cleanflight with (extremely experimental, only useful for developers) profiling support can be found here:
https://github.com/sherlockflight/cleanflight-dev/tree/profiler
You must read the documentation first, which is here:
https://github.com/sherlockflight/cleanflight-dev/blob/profiler/docs/development/Profiler.md
The decoder tool which reads profile logs is here (it’s also my first application written in Go, so it’s probably horrible):


So if I read it right: I can disable usage of the accelerometer and still fly acro/manual but with a lot shorter looptime?
Precisely!
I disabled the accelerator and lowered my looptime….now my quad falls out of the sky 🙁
Which ESCs are you using? I think some of them don’t like sub-1000 looptimes.
Hi Nick,
in text/link above:
“discussing Taylor approximations of our trigonometry routines:”,
is the link pointing to the wrong issue (System – Optimize configuration storage) ?
Thanks, nice work!
Best regards,
Leo
Actually it’s the right link but the (irrelevant to the issue topic) discussion starts right at the end!
EDIT: I’ve now updated the link to post to a new issue which has been submitted to track progress.
I2C read:
I know that a lot of i2c devices these days can run up to 3.4 MHz with small number of devices and short transmission lines on the bus.
I have been running MPU9150 IMU sensor together with BMP180 pressure sensor at 1.5 MHz without any issue. If a low level device is on the bus it’s possible to change the clock speed back to 400 or 100 kHz.
I agree that DMA may be a better solution, but this is quick and dirty, and may lett you read the gyro at 8 kHz 😀
Hi Nick!
Just flown yesterday with looptime=800, without accel… It was very nice! Thanks for constant digging and improving. BTW, had no issues with BB, 115200, OpenLog, Long headers 🙂 denominator=4… 🙂
FedorCommander
Hi Nicholas!
Thank you for this interesting blog post!
Would I even notice the shorter looptime with Harakiri or Luxfloat on a Naze32 when disabling the acc?
Do all the PID controllers use the same floating point operations or do they each have their own?
Regards, Alex
The IMU calculations are very slow compared to all the PID controllers, so the speedup from disabling the IMU will definitely be felt.
Some of the PID controllers use no floating point operations (like the MultiWii derivatives), while others like Harakiri or LuxFloat are very strongly floating point based. They use similar floating point operations (basically just multiplication and addition).
So would this also work on the cc3d?
You mean the speedup from disabling the accelerometer? Yep, that’ll work fine!
If you mean the profiler, I haven’t included it into the target.h file for CC3D, but it should work (however you need to assign the right timers to the profiler).
Isn’t this just the trig functions used to rotate the EstG (estimated gravity) vector that is sucking up time? Those could trivially be replaced by lookup tables…..
/Z
There is a bunch of time involved in just simple multiplies, divides and additions as well, so speeding up the trig functions isn’t everything. But yes, there is speedup to be had from improving the trig. Check out this PR for a faster trig approximation solution: https://github.com/cleanflight/cleanflight/pull/1092
I don’t know the current state of the source code, but shouldn’t the i2c-Read in the last scenario be faster because there are less registers to read without the acc? if not it should be the place for your next optimization
Yes, it does currently avoid reading the accelerometer I2C registers when the acc is disabled, so there will be a speedup from that.
Has anyone added something so we can get accSmooth in the Blackbox but not run the IMU attitude code? Couldn’t we also use the Blackbox viewer’s IMU code in the Configurator so it still worked without the FC’s IMU? When looking at the code it appears it still runs but all acc inputs are 0. Is that correct or am I missing where the code is skipped?
That ability has not been added yet, but yeah that would be an interesting idea for the Blackbox. It doesn’t seem like that would be a useful feature for the Configurator since the 3D model would just be window-dressing at that point (wouldn’t reveal the actual attitude estimate of the FC so doesn’t reveal anything about potential flight problems).
The skipping of the IMU happens here:
https://github.com/cleanflight/cleanflight/blob/master/src/main/flight/imu.c#L304
imuCalculateEstimatedAttitude() is never called when an accelerometer sensor is not present.
Wow, Brilliant post. Thanks for sharing.